S-Curve in Construction: How to Read Planned, Actual and Earned Progress
What a construction S-curve shows, how to read its planned, actual and earned curves, and why a healthy-looking curve still needs a critical path check.
Picture a monthly report whose progress curve sits a few points under plan, with a narrative that calls the gap minor. Two updates later the forecast completion has moved six weeks. Nothing on the curve changed shape in between, because the curve was never measuring the work that drives the finish.
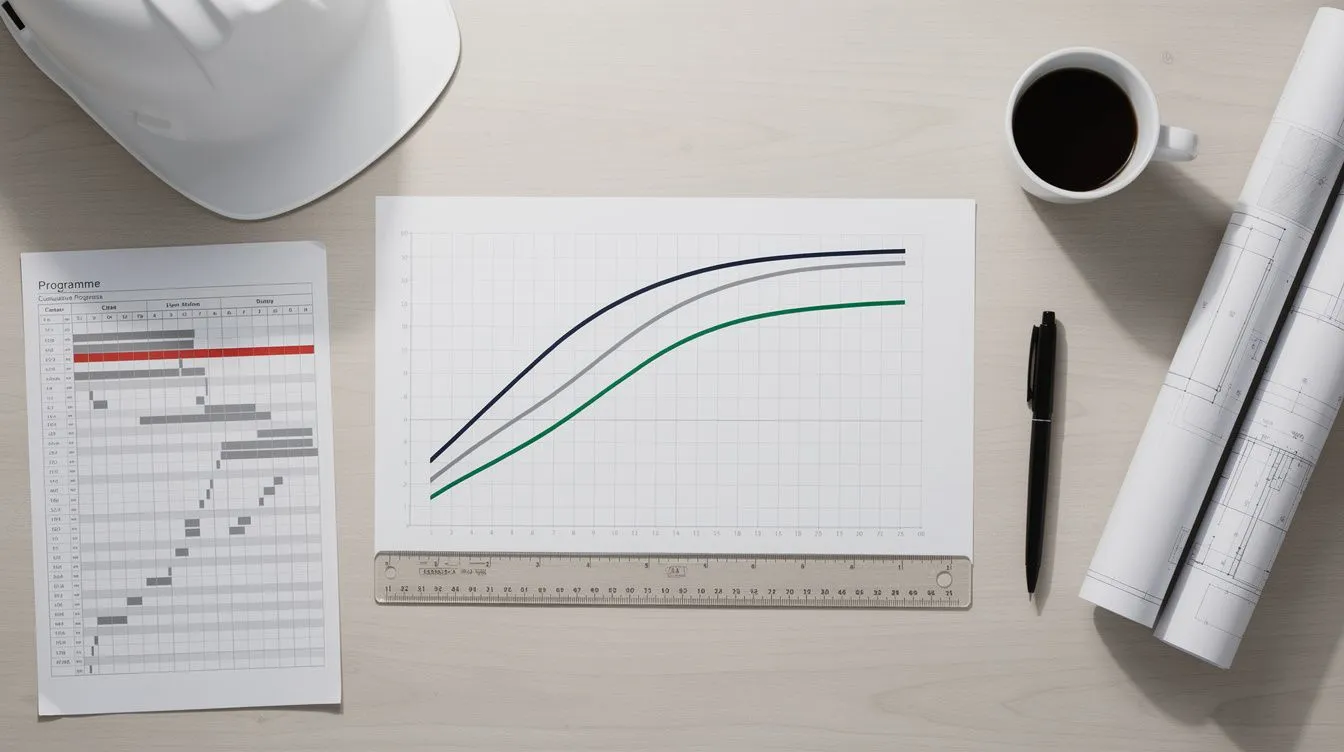
A construction S-curve plots cumulative progress over time. It starts shallow during mobilisation, steepens through the main works and flattens as the project nears completion, which is the shape that gives it its name. On most projects three curves share the chart: the planned curve from the accepted programme or budget, the actual curve from recorded progress, and an earned curve showing the work completed at its planned value.
Those lines can tell you something useful, or something that only looks useful. This guide covers what each curve shows, how to read the gap between them, and where a curve needs the critical path, the logic and the contemporaneous records before you act on it. An S-curve is one input to a structured construction schedule analysis, never a substitute for one.
What an S-Curve Shows
An S-curve is a cumulative line chart. The x-axis is time: calendar months, reporting periods or data dates. The y-axis is a running total against a fixed target, such as percentage complete, contract value, cost, labour hours, installed quantities or duration-weighted progress. Each unit answers a different question, so check which one the chart uses before you draw a conclusion from it.
| Curve | What it measures | Depends on | Common weakness |
|---|---|---|---|
| Planned | What the accepted programme or cost plan said should be complete by each date | A frozen, accepted baseline | Rebaselined mid-project without restating earlier periods |
| Actual | What has been recorded as done, spent or installed | Timely, complete progress entry | Self-reported progress, invoice spikes, a stale data date |
| Earned | Work completed, credited at its planned value or duration | Honest progress measurement | Estimated quantities, scope changes left out of the baseline |
Table: The three curves, what each depends on, and where each usually goes wrong.
In cost-based earned value management (EVM), the planned curve is Planned Value (PV), the earned curve is Earned Value (EV) and the actual curve is Actual Cost (AC). Where cost data isn’t available, as is often the case with programmes submitted for review, the same logic works on percentage complete, quantities or duration-weighted progress against the baseline. The method carries over; the precision of the data usually doesn’t.
An S-curve doesn’t show logic links, constraints, calendars, critical path membership or float. It treats every unit of progress as equal, whether it’s a slab pour on the critical path or a non-critical activity with months of float.
Why Construction Progress Curves Are S-Shaped
The shape follows the way construction work unfolds. Early on, mobilisation, site establishment and procurement produce little measured progress. The work that does happen, such as temporary works, setting out and early submittals, is a small share of the total scope.
Once the main works start, several trades and workfronts run at once. Structures rise, services go in and the number of open activities peaks. This is the steep middle of the curve, where most of the project’s value and duration is consumed.
Near completion the open activity count falls. What’s left is fit-out, commissioning, testing and defects: many small items that together make up the last few percentage points. Each extra unit of progress takes longer to earn, so the curve flattens.

Figure: The three phases that give the curve its shape. Most of the value and duration is earned in the steep middle.
The pattern holds whatever the y-axis measures, but the steepness of each phase depends on procurement, phasing and the level of detail in the programme. A single building with one main contractor gives a smoother curve than a multi-structure programme with staggered starts. Treat the shape as a pattern, and don’t read meaning into the slope at a given month without knowing what the programme says should be happening then.
Planned, Actual and Earned Curves
The three curves aren’t interchangeable. Each answers a different question and draws on different data.
The planned curve
The planned curve is the reference line. It plots what the accepted programme or cost plan said should be complete by each date, and on a well-run project it’s frozen at baseline acceptance. If it’s rebaselined mid-project without the earlier periods being restated, the cumulative total jumps and any variance measured against it understates the drift. Check whether the line on the page is the original baseline or a rebaseline before comparing against it; the baseline vs current comparison guide covers that discipline.
The James Webb Space Telescope shows why. After a replan in September 2011, NASA rebaselined the project at a life-cycle cost estimate of $8.835 billion with a planned launch in October 2018, according to the US Government Accountability Office’s December 2015 review (GAO-16-112). GAO’s later reviews then reported the project as progressing within the 2011 replan, not the original plan. A curve that reads close to plan after a rebaseline says the project is tracking its newest target; it says nothing about the drift that forced the replan.
The actual curve
The actual curve plots what has been recorded as done, spent or installed by each data date. Its shape depends on how promptly and completely progress is entered. A contractor who reports a week late produces a flat period followed by a catch-up step, and the flat period reflects data entry, not site activity. If cost is the y-axis, one large procurement invoice makes a single month look busier than it was.
The earned curve
The earned curve credits completed work at its planned value or planned duration, not at what it cost. A task planned at 20 working days that’s half complete earns 10 days of progress, however long it’s actually been running. So the actual curve reports what was spent and the earned curve reports what was achieved. The gap between them, the cost variance, means something only if the planned values are realistic and the progress measurement is honest.
A worked example
Suppose a nine-month project reaches its month 6 data date. The figures below are hypothetical and shown as a percentage of the budget at completion.

Figure: The hypothetical project at its month 6 data date. Earned value sits 10 points under plan (SPI 0.84). Read across in time, the 52% earned was planned for month 5.3, so the project is about three weeks behind (SPIt 0.88).
| At the month 6 data date (hypothetical) | Value | What it says |
|---|---|---|
| Planned (PV) | 62% | Work the baseline expected by now |
| Earned (EV) | 52% | Work done, at its planned value |
| Actual (AC) | 58% | What that work cost |
| SPI = EV ÷ PV | 0.84 | Earning work at 0.84 of the planned rate |
| CPI = EV ÷ AC | 0.90 | Each unit of work is costing more than budgeted |
| SPIt = ES ÷ AT | 0.88 | The 52% earned was planned for month 5.3, so about three weeks behind |
Table: The month 6 position from the hypothetical chart, with the earned value ratios and the Earned Schedule index worked from it.
On this hypothetical project the earned line has fallen ten points behind the plan and the work is costing more than budgeted. What the chart can’t say is whether the missing ten points sit on the critical path.
How to Read Variance Before You Act on It
When the earned or actual curve sits below the planned curve, the project has delivered less than the plan expected by that date. When the earned curve sits below the actual curve, the completed work has cost more or taken longer than its planned allowance. Treat them as signals to investigate before anyone calls them a diagnosis.
Key warning: A healthy-looking S-curve can hide a slipping critical path. Check what the schedule logic says about the finish date before you act on any variance.
What a healthy curve can hide
The curve counts how much work has been done, not which work. A project can show steady cumulative progress while the critical path stalls, because work with float keeps moving and lifts the total. The variance looks acceptable and the completion date moves right without anyone seeing it on the chart. Only the critical path tells you whether the completed work is the work that drives the finish.

Figure: The same hypothetical project seen two ways. The curve sits three points under plan while the forecast finish moves six weeks across two updates.
A programme can carry these faults and still produce a curve that looks fine:
- Hard constraints fixing dates that the logic should drive
- Calendars giving seven-day weeks to five-day work
- Missing logic links, so activities float free of their predecessors
- A contractual completion milestone sitting well past the programme’s own finish date
None of them shows on an S-curve, because the curve takes its dates and values from the programme underneath it. An unsound programme produces an unsound curve that looks sound on the page. The Project Management Institute’s Standard for Earned Value Management (2019) makes the same point about the earned value figures themselves: a positive variance “does not necessarily mean that the work is being executed according to the sequence planned in the schedule baseline”.
What the thresholds tell us: The Defense Contract Management Agency 14-Point Assessment caps missing logic and hard constraints at 5% of incomplete tasks each. The DCMA 14-Point guide sets out all fourteen checks.
What it means: Over either threshold, many of the dates the curve plots come from fixed constraints or open-ended activities rather than calculated logic. The curve inherits those dates, so a programme that fails these checks can’t support a variance reading until the logic is repaired.
Verification order before you trust a curve

Figure: Four checks, in order, before a variance on the curve becomes a finding.
Where SPI, CPI and Earned Schedule Fit
Earned value management turns the curves into two ratios a project board can track month to month:
- SPI (Schedule Performance Index) = EV ÷ PV. Above 1.0, more work has been earned than planned by this date; below 1.0, the project is earning work more slowly than planned.
- CPI (Cost Performance Index) = EV ÷ AC. Above 1.0, the earned work cost less than budgeted; below 1.0, it cost more.
Both ratios rely on realistic baseline values, honest progress measurement and the same baseline anchoring the planned and earned curves. On construction programmes submitted for review those conditions rarely hold in full: submitted Primavera P6 exports are often not cost-loaded, progress is often self-reported, and the baseline is sometimes missing.
Even where cost data exists, the ratios inherit its quality. GAO’s review of the James Webb Space Telescope found the project’s cost position relied partly on contractor-provided performance data “that contains anomalies that render the data unreliable” (GAO-16-112). The telescope was meeting its cost commitments at the time; GAO’s warning was that the unreliable performance data behind that statement “may pose a risk to project management”.
PMI’s Practice Standard for Scheduling notes that EVM “can be expanded to include the concept of earned schedule” to give time-based indicators alongside the cost-based ones. To work SPI and CPI from your own cost figures, use the free earned value calculator.
Read the same curve in time
Earned Schedule asks a different question of the same two curves: by what date was the work done so far planned to be done? On the hypothetical project, the 52% earned at month 6 sits between the plan’s 48% at month 5 and 62% at month 6, so it was planned for about month 5.3. That is the earned schedule. Divide it by the actual time and the time-based index is SPIt = 5.3 ÷ 6 = 0.88: the project is about three weeks behind, and a nine-month plan earned at that pace takes about 10.2 months.
The reason to prefer the time-based reading shows up late in a project. The NDIA’s Predictive Measures Guide (2025) notes that SPI “returns to 1.0 and SV returns to $0 at the completion of every project, regardless of whether planned commitment dates were met or not”, which makes it “an ineffective measure of project performance over the final 1/3 of the project”. SPIt keeps measuring in time to the end, so a late finish still reads as late.
| SPI (cost or value based) | SPIt (Earned Schedule) | |
|---|---|---|
| Formula | EV ÷ PV | ES ÷ actual time |
| Units of the gap | Percentage points or dollars | Days, weeks or months |
| Worked example | 0.84, ten points behind | 0.88, about three weeks behind |
| At completion | Returns to 1.0 whether the finish was late or not | Stays below 1.0 if the finish was late |
| Needs | A baseline spread over time and progress against it | The same, plus the baseline’s dates |
Table: The same two curves read two ways. SPIt reports the gap in time, which is the unit a completion date is measured in.
What ScheduleLens measures against your baseline
ScheduleLens reads the same thing from the programme files themselves, weighting work by the baseline’s durations because submitted programmes rarely carry cost:
- A comparison report against your approved baseline gives the Earned Schedule forecast with SPIt, shown beside the programme’s own finish date, and the pace that finish now requires of the remaining work. NDIA’s guide flags a gap of more than 0.10 between the two as a prompt to investigate.
- A series report tabulates the pace against the baseline in every period, says when the programme held its finish date while the pace it needs kept rising, and draws a duration-weighted progress S-curve: planned against actual, with the plan’s early and late dates drawn as a band.
- A tracked project dashboard carries the Earned Schedule forecast for every update, so the pace against the baseline is visible across the life of the project.
Each is a scenario on the rate of work, not a reschedule. It sits beside the programme’s finish rather than replacing it, and it is shown only against an approved baseline.
Questions to Ask Before You Trust the Curve
Before acting on a curve, check what sits underneath it:
- What programme produced the planned curve? If the baseline was never formally accepted, the planned curve is a working document, not a contractual yardstick.
- Is the data date current? An old data date stops the actual line short, so the real gap may be larger than the chart shows.
- Is progress measured or self-reported? Contemporaneous records verify progress: site diaries, photographs, delivery dockets and inspection reports.
- Does the critical path support the story? Suppose a curve reads 85% complete while every remaining activity is critical and none has started. The last 15% will take far longer than the curve’s slope suggests.
- Has the scope changed? Added work inflates the earned curve against the original plan unless the baseline is adjusted.
- What unit is the y-axis? A cost curve can rise on invoices while physical work stalls, and a quantity curve can look stalled before work reaches a measurement point.
| If you see this | Check this | Before concluding |
|---|---|---|
| Actual below planned | Is the data date current? | It isn’t a delay finding until the critical path shows it |
| Earned below actual | Is cost inflated by procurement timing? | A real overrun or an invoice spike? |
| Healthy curve, slipping finish | Progress on critical versus non-critical work | The logic outranks the line |
| Earned above planned mid-project | A rebaseline, scope growth or over-reported progress? | It may be an artefact, not acceleration |
Table: Common curve readings, the check each one needs, and what to hold back on until it’s done.
Common S-Curve Mistakes
Comparing percentages from different baselines. A rebaselined planned curve has a new total. Comparing its percentages with the original baseline’s compares two different targets, so the variance describes the rebaseline, not the drift.
Treating cost as physical progress. A cost curve rises when invoices are paid. A procurement-heavy month can lift the actual curve above plan while site progress is stalled, so check physical progress before reporting a cost curve as progress.
Ignoring the data date. If the data date hasn’t moved between reports, the actual curve stops advancing and the gap widens on paper. Check the data date first.
Calling every below-plan curve “delay”. A variance is a data point. It might be delay, a rebaseline, a data date lag, a measurement change or unreported progress. A delay finding needs the shortfall on the critical path, a later forecast completion and no reporting artefact to explain it. The forensic schedule analysis guide covers the methods that can show it.
Frequently asked questions
What is an S-curve in construction?
A cumulative chart of progress over time, showing how much work has been completed, spent or earned by each reporting date. It's usually measured in percentage complete, contract value, labour hours or installed quantities, and its shape (shallow start, steep middle, flattening finish) gives it the name.
What is the difference between a planned and an actual S-curve?
The planned curve shows what the accepted programme or budget said should be complete by each date. The actual curve shows what has been recorded as done, spent or installed. The gap between them says the project has diverged from the plan, but not why.
Is an S-curve the same as earned value?
No. Earned value management uses S-curves to display Planned Value, Earned Value and Actual Cost, and derives SPI and CPI from them. The S-curve is a chart; earned value is a management method that uses it.
Can an S-curve prove a delay claim?
No. It can show that cumulative output has fallen behind plan, but not causation, critical path impact or entitlement. A delay claim needs critical path analysis, such as a Time Impact Analysis or a windows analysis, supported by contemporaneous records.
What data do I need to build a construction S-curve?
A baseline plan with values, durations or quantities spread over time, progress data for each period and one consistent unit. An earned value S-curve also needs the earned value of completed work and its actual cost.
Does ScheduleLens calculate SPI from uploaded schedules?
No. Uploaded programmes rarely carry cost loading, so ScheduleLens doesn't report cost-based SPI or CPI. Where you give it an approved baseline it reports Earned Schedule's time-based index, SPIt, and a series of updates gets a duration-weighted progress S-curve.